


What ERAMON can do – and what you need from it
ERAMON is not a monolith. Start with the base module and add as needed. No overbuying, no unused licences.
Product Highlights (Selection)

Module Overview
The foundation
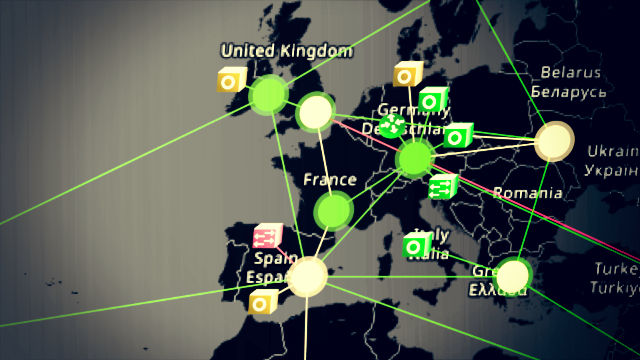
Topology, asset management, basic monitoring. Vendor-independent for WAN and LAN.
Automatic detection
Network devices are automatically detected and inventoried.
Users & permissions
Multi-level permission model with individual views.
- Automated scans with host discovery and more
- Asset Management – active and passive devices, incl. software status
- ICMP, SNMP, SSH – basic connectivity monitoring
- Scales seamlessly to 100,000+ devices
Real-time monitoring
All devices, connections and services – continuously monitored.
Alerting rules
Configurable thresholds, SMS/email, escalation logic.
Historical analysis
Outage history for root-cause analysis.
- Short response time for faults and outages
- SMS, email, SNMP trap – threshold-based alerting
- Escalation logic – who is notified when?
- Outage analysis – for SLA reports and root-cause research
Line monitoring
All WAN connections in one view.
SLA monitoring
Availability, latency, packet loss – SLA reports automated.
Capacity planning
React to long-term trends early, e.g. to order additional bandwidth in time.
- Bandwidth analysis – utilization and capacity reserves
- Carrier-independent – fast switching without tool migration
- Site overview – ideal for companies with multiple locations
Switch port management
Identify free capacity (e.g. so-called “zombie ports”) and use existing resources.
VLAN monitoring
Analysis of traffic in individual VLANs.
L2/MAC tracking
Which device is where? Available at any time.
- Port occupancy history – for troubleshooting and forensic analysis
- WLAN controller integration – access points integrated
- Vendor-independent – incl. Cisco, Juniper, Barracuda, Check Point
Config backup
Automatic backup of all configurations. Rollback in minutes.
Compliance check
Comparison against standards – deviations immediately visible.
Change history
Who changed what, when – audit-ready.
- Config diff – immediately visible what has changed
- 85% time savings in provisioning (reference value)
- On-premises – no cloud upload of configuration data
Long-term analysis
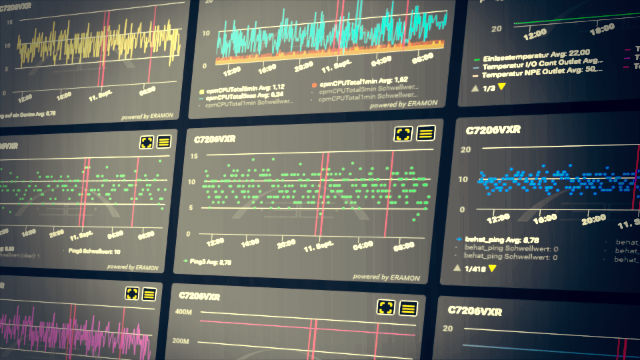
Days, weeks, months – make performance trends visible.
Performance focus
Utilization, temperature, quality – all data always in view.
Management dashboards
Custom views for technical and management level.
- Automated reports – scheduled delivery to management and controlling
- Bottleneck analysis – where are the bottlenecks?
- PDF/CSV export – for your documentation