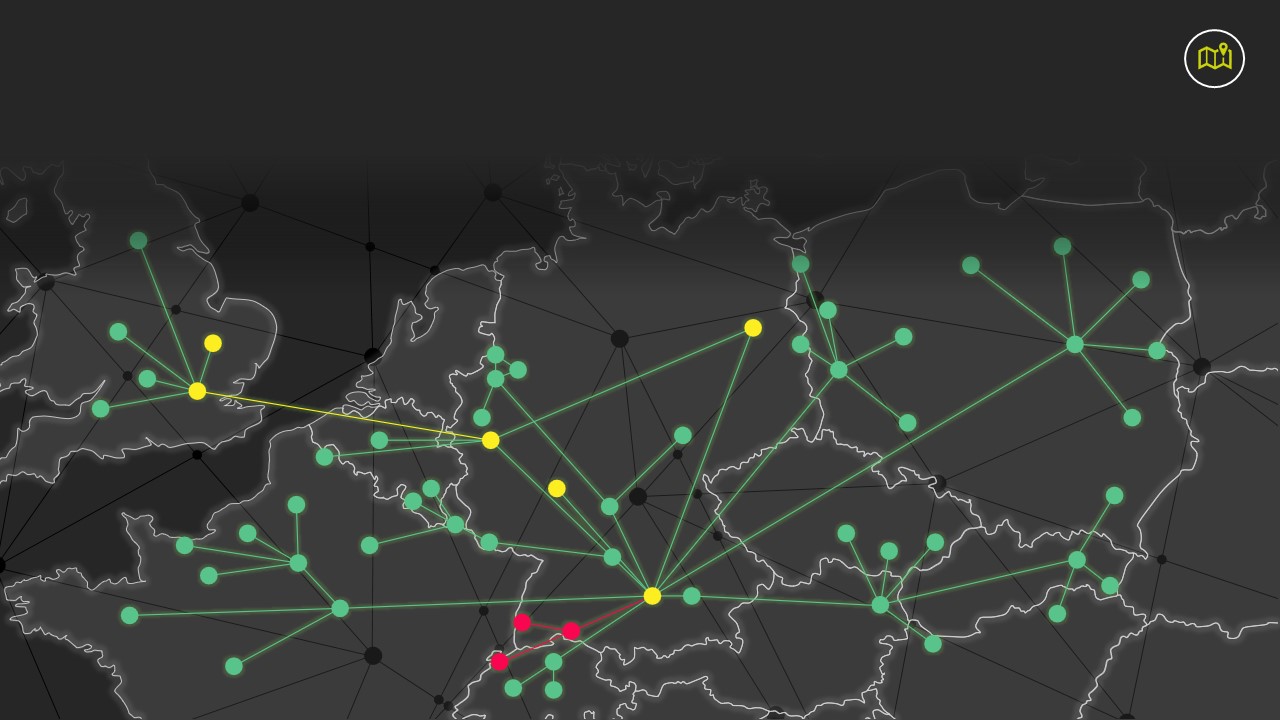
ERAMON’s Topology View has been developed to provide ISPs, carriers and enterprise customers with a flexible tool to create and display a clear view of their WAN infrastructure. All based on pure HTML.
Topology View
Benefits
- You will see an up-to-date status of your network in its geographical context
- You will recognize local dependencies at a glance
- You will be able to simplify complex network structures on the basis of topological views in real-time
Visual of the network

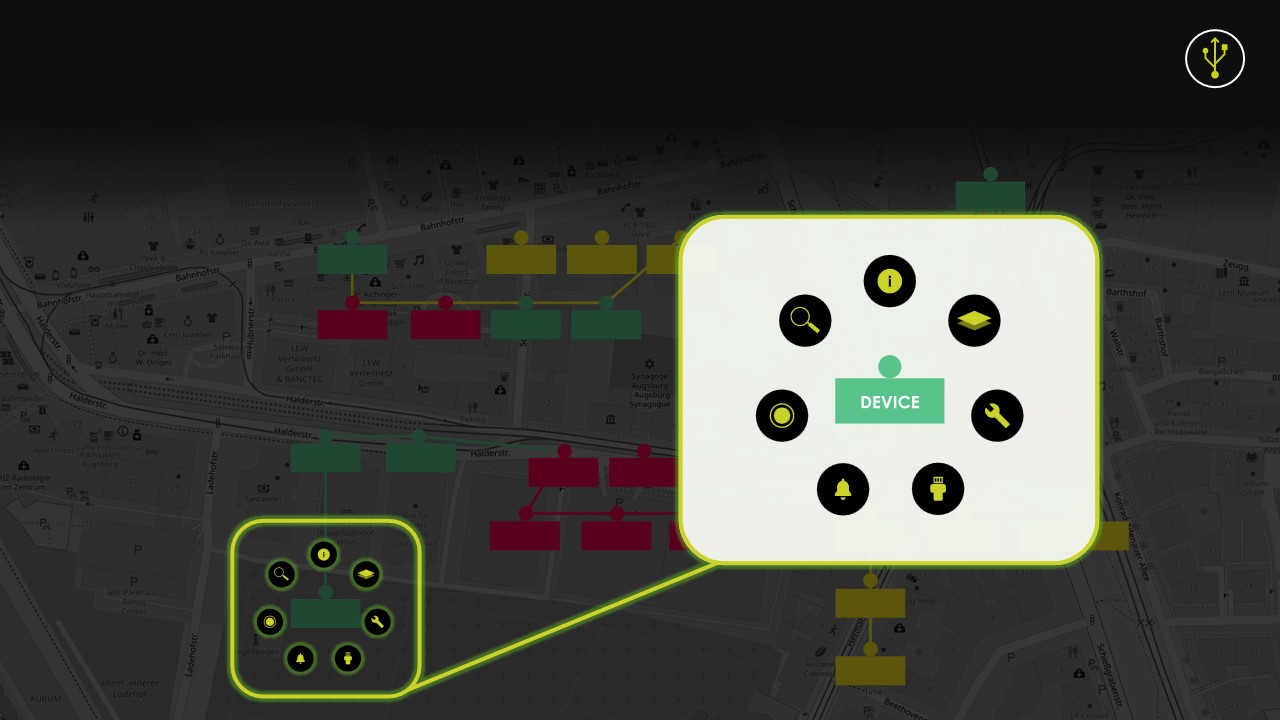
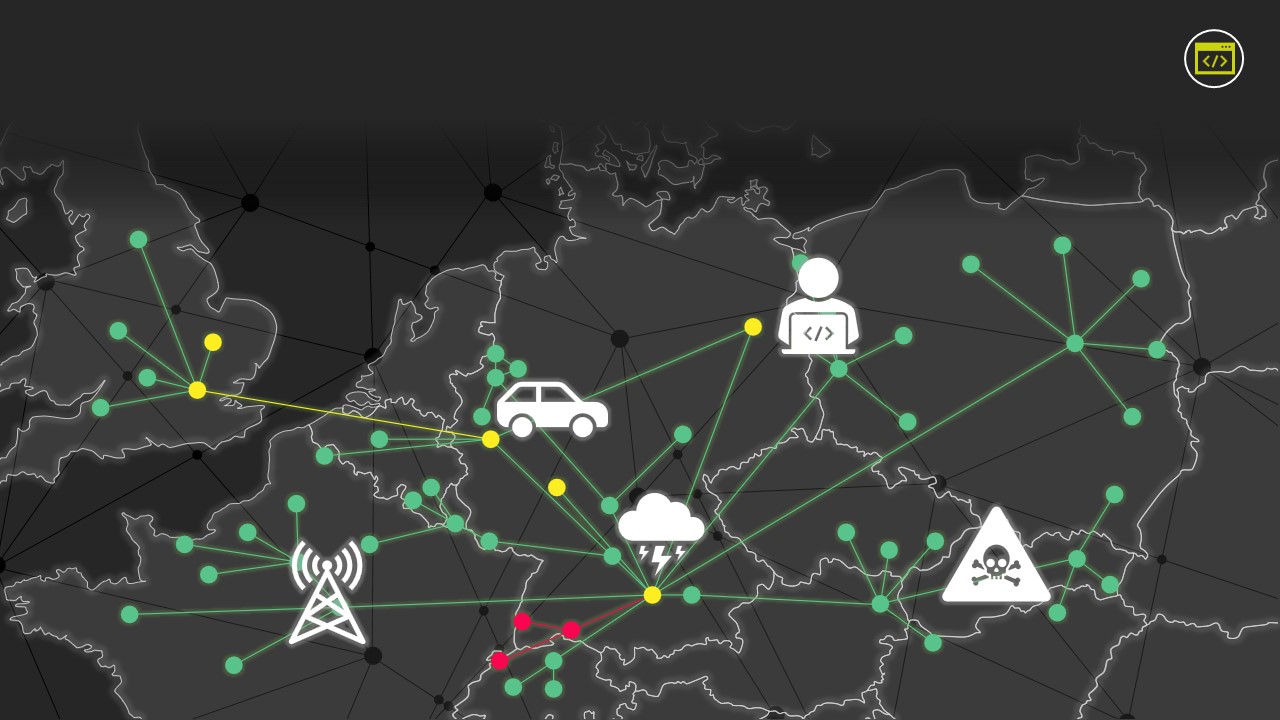
In addition to the automatic geographic positioning, you also have the option to position devices manually when in setup mode. Depending on their individual authorization levels, users in ERAMON can define and edit graphical views or just have them displayed. On these maps the devices are shown as symbols (ITU standard) and are assigned a background color depending on their status (ITU weighting). You could also specify your own weighting and have the option to replace these symbols with customized ones.
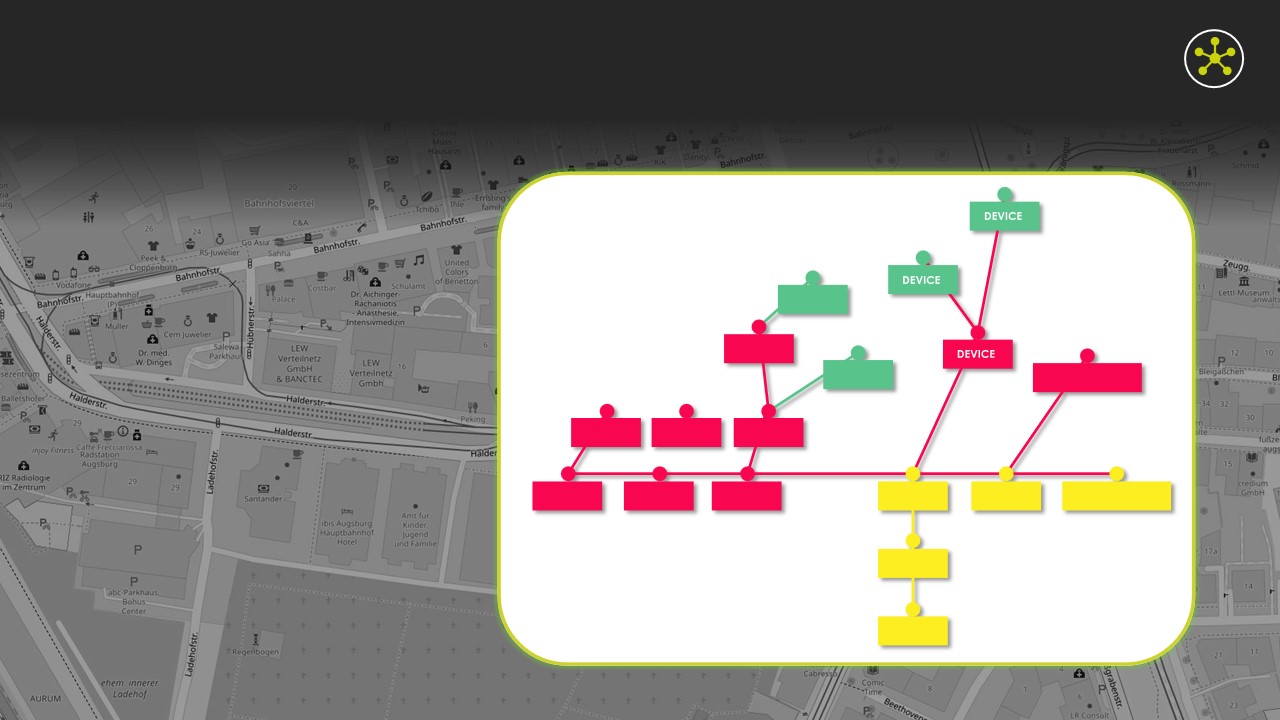
You can also generate submaps, which leads to the display of multiple hierarchy levels (such as country – state – district) and also corresponding to topology levels. In general, it is also possible to make use of very diverse maps, such as country or city maps or building/plant layouts. Images without geographical context to the display of topologies can also be used.
Display options
By default, topology view enables you to change views at the click of a button:
- Weathermap
The connections are displayed based on the current bandwidth usage (%). The colors are pre-defined, but can be adjusted individually for each map. - Bandwidth
In this mode the thickness of the displayed line relates to the connection´s bandwidth. You also have the option to use different colors for the display.